 Alerua
Using Alerua
What Alerua Pro adds
Past storms on any US radar, loops up to 60 scans long, and radar colors of your own.
What is free
Every radar, every product and everything live is free: the map, loops of up to 25 scans, 3D, AR, warnings, hurricanes, forecast maps and the widgets. Alerua has no ads, no tracking, and Pro is how we keep it that way. Pro has its own page in the Settings tab, on iPhone and Mac.
Storm replay
Replay plays back any US radar on any day since 2009, three hours at a time, from NOAA’s archive of NEXRAD scans. It has every product the radar recorded that day. A storm from before a radar’s dual-polarization upgrade has reflectivity and velocity, and no correlation coefficient.
Press the replay button next to search, a clock with an arrow round it. Choose a radar, a day and three hours. A strip shows the day’s scans as bars, taller where a scan holds more weather, and it opens on the busiest three hours. Choose Download, and a ring fills round the button as the scans arrive, in about a minute.
A replay is kept on your device and plays without a connection. Ten can be kept, each for seven days, and ten can be downloaded in a day. While one plays, 3D, AR, warnings and storm tracks are off.
Longer loops
The free loop plays up to 25 scans. Pro adds 30 and 60, on the flat map and in 3D. A NEXRAD radar finishes a scan every 4 to 10 minutes, so 25 scans reach back about 2 to 4 hours and 60 reach back about 4 to 10. Length is in the radar’s settings, under Loop.
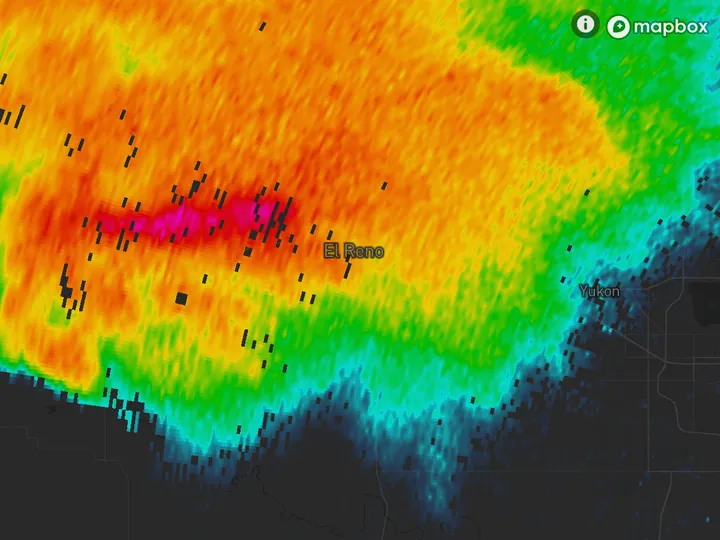
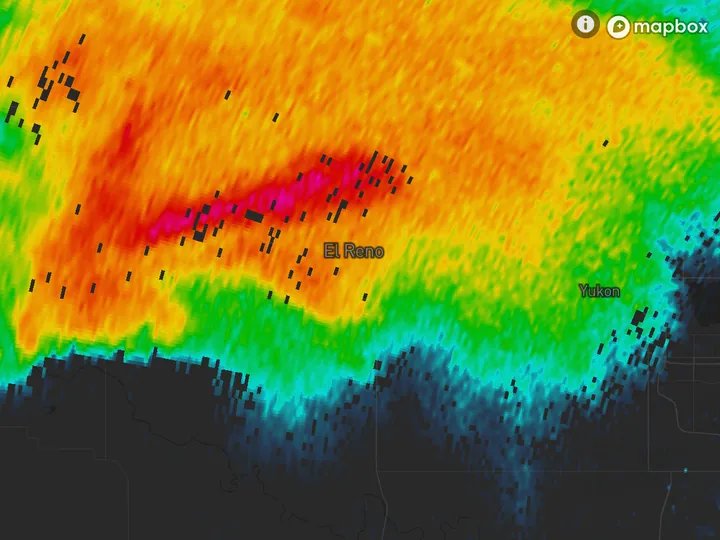
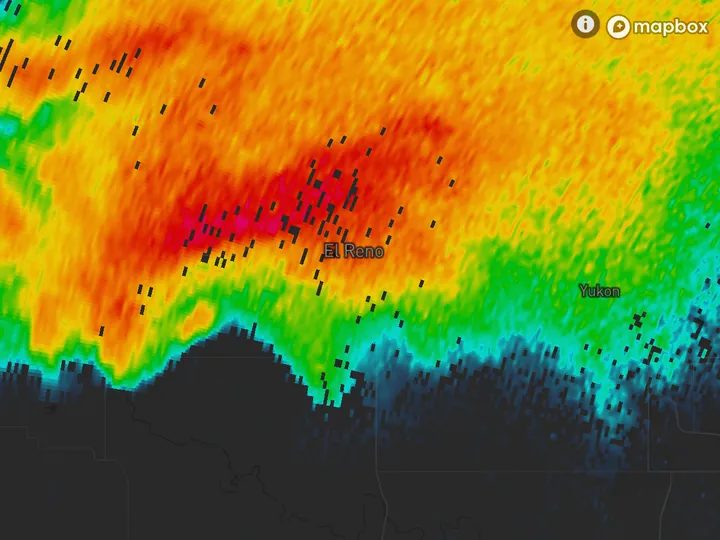
On August 10, 2020 the Des Moines radar’s 60 scans began at 7:39 AM CDT, with the derecho’s first storms still near the South Dakota border. Its 25 began at 10:28 AM, with the line already west of Des Moines. By the newest scan, at 1:03 PM, it was east of Cedar Rapids.
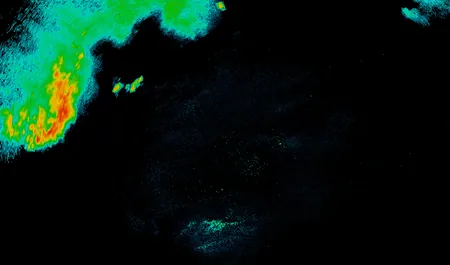
- KDMX Des Moines
- 7:39 AM CDT
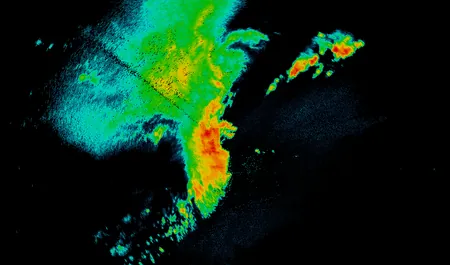
- 10:28 AM CDT
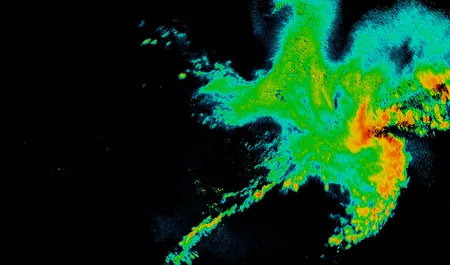
- 1:03 PM CDT
Your own colors
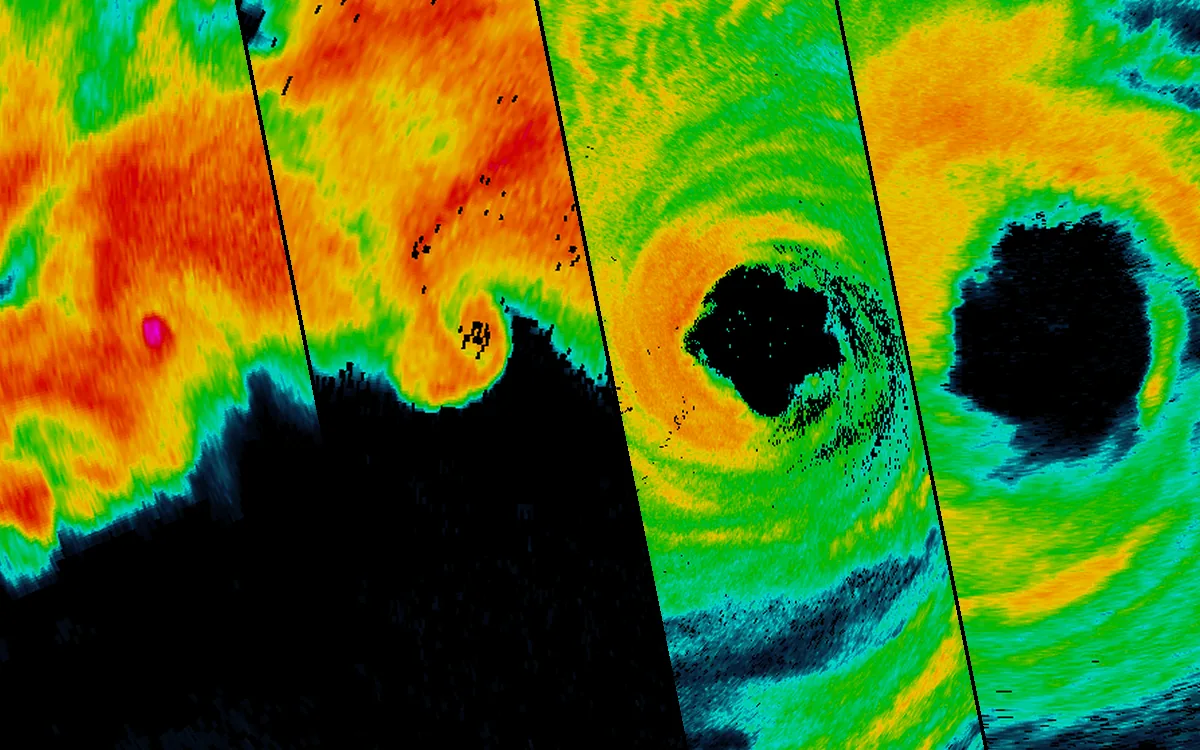
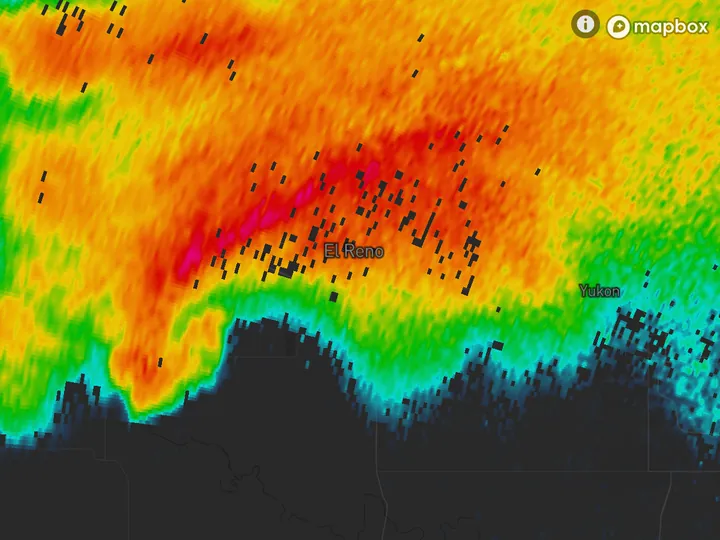
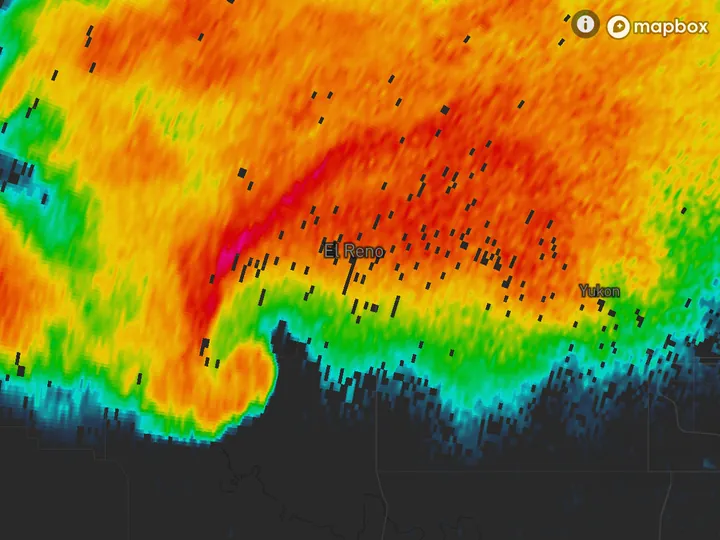
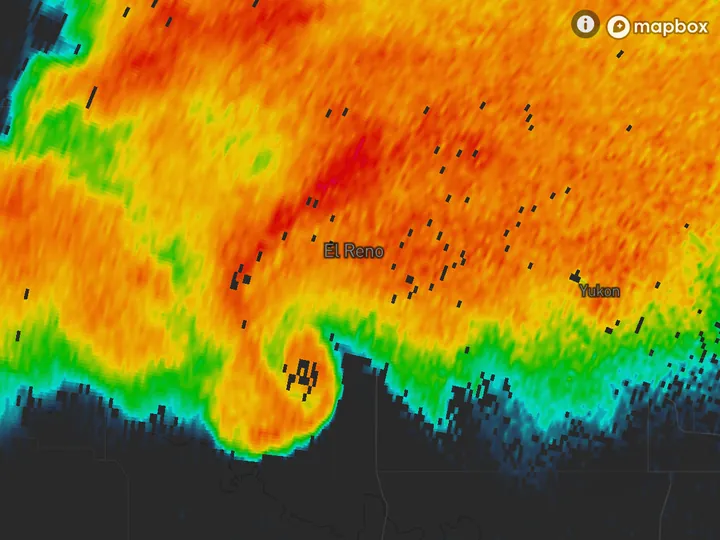
The four styles have fixed colors. With Pro you can make your own scale for reflectivity or velocity, one color for each value, or import a .pal color table. Each scale is a row in the Style menu.
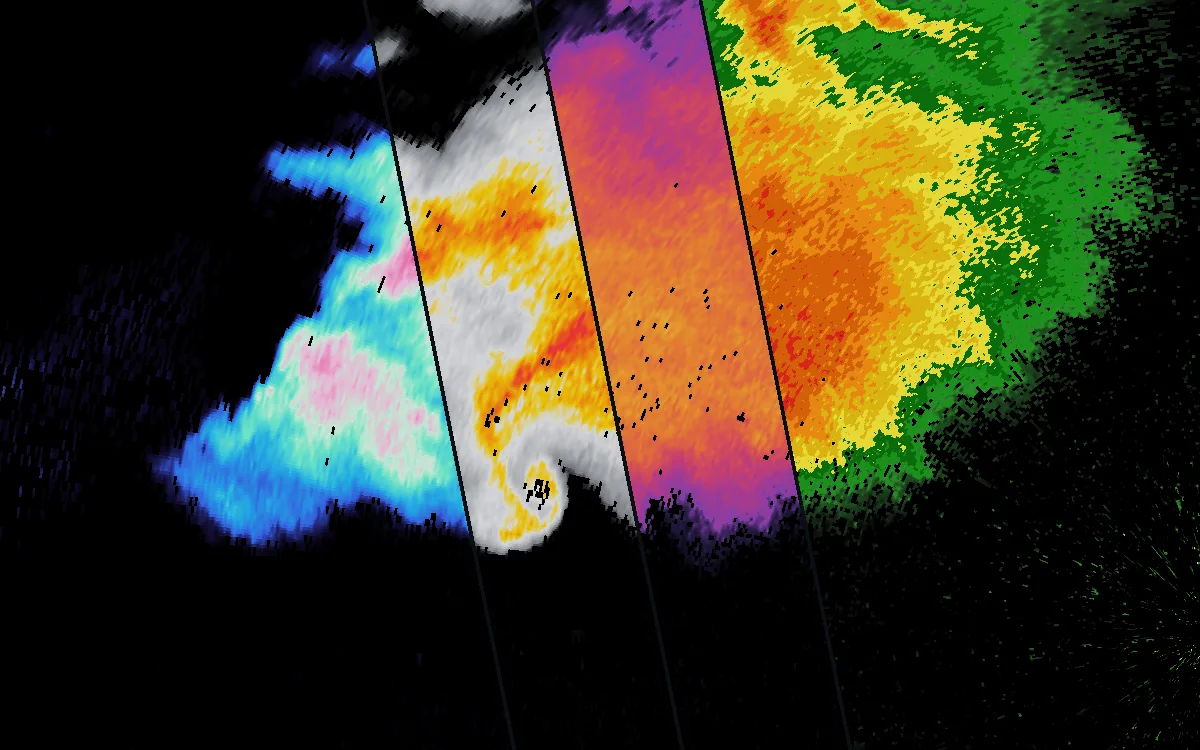
- KTLX Norman, Oklahoma
- 6:14 PM CDT, May 31, 2013
- Four custom scales
Keep reading
- Using AleruaMake your own radar colorsOne color for each value, blended or in steps, four example scales, and how to import a .pal color table.
- Using AleruaHow to use the Alerua radar mapEvery control on the radar page, from Product to Settings, and what the tilts see.
- 3D radar3D weather radar, explainedHow a 3D view is built from the radar’s tilts, what it shows that a flat map can’t, and where it can mislead.
Further reading
Radar data from NOAA’s NEXRAD Level II archive. Base map © Mapbox © OpenStreetMap contributors.